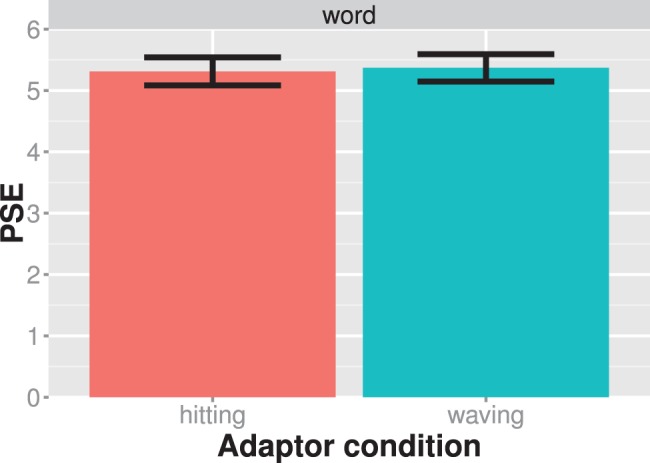
Figure 6. Results of experiment 4.

The average PSE is shown for each adaptor condition separately. Larger PSE values indicate that the test stimulus showed more of a waving action. Bars always indicate one standard error of the mean.

The average PSE is shown for each adaptor condition separately. Larger PSE values indicate that the test stimulus showed more of a waving action. Bars always indicate one standard error of the mean.