
Figure 6. Results of experiment 4.
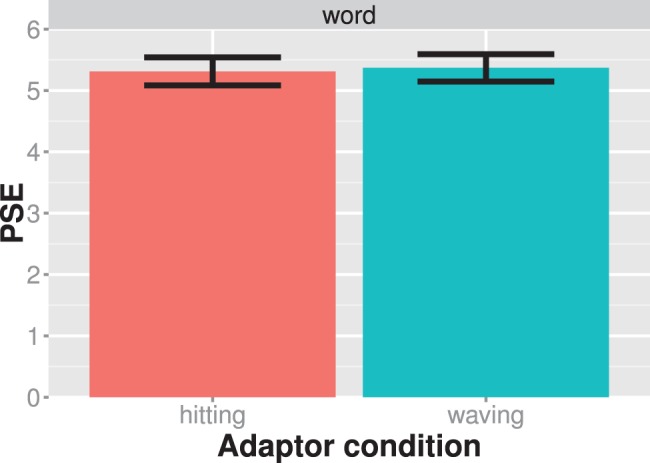
The average PSE is shown for each adaptor condition separately. Larger PSE values indicate that the test stimulus showed more of a waving action. Bars always indicate one standard error of the mean.
Official websites use .gov
A
.gov website belongs to an official
government organization in the United States.
Secure .gov websites use HTTPS
A lock (
) or https:// means you've safely
connected to the .gov website. Share sensitive
information only on official, secure websites.
The average PSE is shown for each adaptor condition separately. Larger PSE values indicate that the test stimulus showed more of a waving action. Bars always indicate one standard error of the mean.