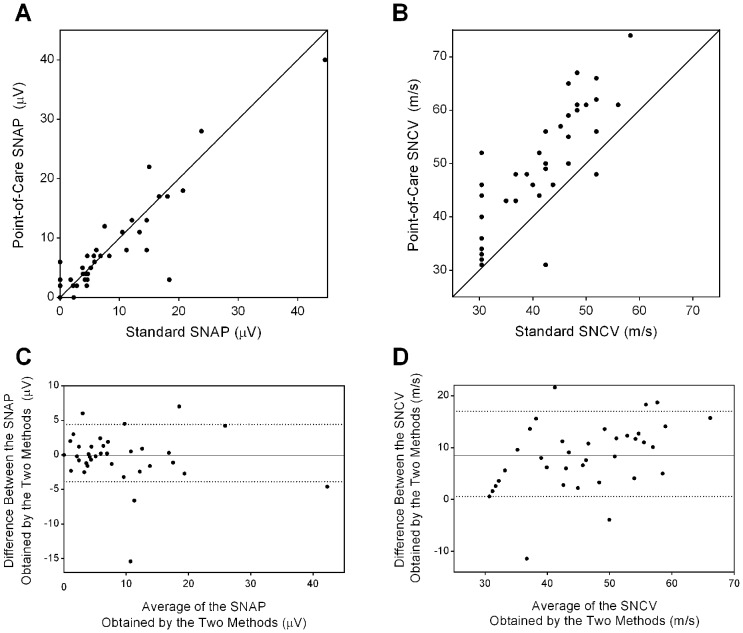
Figure 2. Scatterplots (A,B) and Bland-Altman plots (C,D) for comparison of the point-of-care nerve conduction method versus standard NCS for SNAP or SNCV.
Panels A and B: Scatterplot of SNAP (A) and SNCV (B) showing the line of unity (diagonal solid line) between the two methods. Panels C and D: The Bland-Altman plots demonstrating the mean difference (depicted by the solid line) between SNAP (C) or SNCV (D) obtained by the two methods. Points above or below zero on the y-axis represent over- and underestimation by the point-of-care device, respectively. The dotted lines represent the upper and lower limits of the 85% confidence interval. Unrecordable SNCV results for both nerve conduction methods were assigned a value of 30.4 m/s, representing the lowest value in the dataset. Such data handling was applied to 9 values for standard NCS and 3 values for the point-of-care device.

