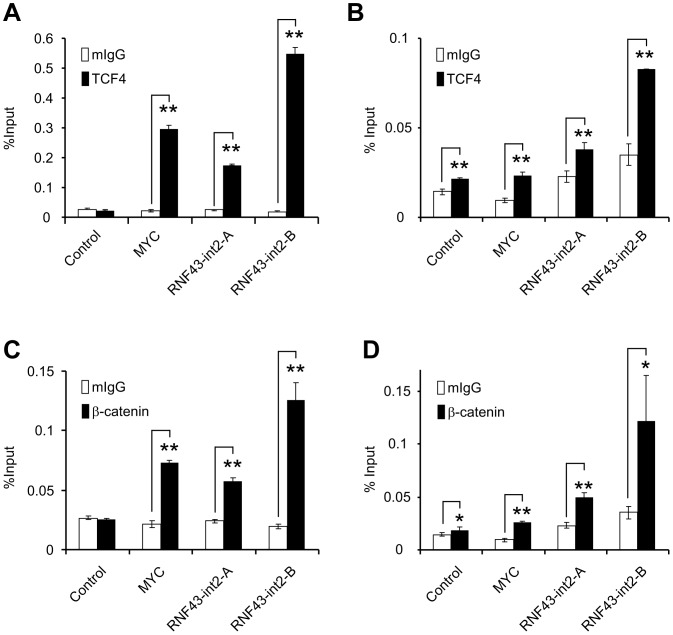
Figure 5. Association of the two WREs with Tcf4 and β-catenin.
A, B) Quantification of precipitated regions by a ChIP assay with anti-TCF antibody was performed in HCT116 (A) and SW480 (B) cells using real-time PCR (mean ± standard deviation). Closed boxes indicate ChIP assay with anti-TCF4 antibody, and open boxes with control IgG. C, D) Quantification of precipitated regions by a ChIP assay with anti-β-catenin antibody in HCT116 (C) and SW480 (D) cells. A significant difference was determined by Student’s t-test (*; P<0.05, **; P<0.01).

