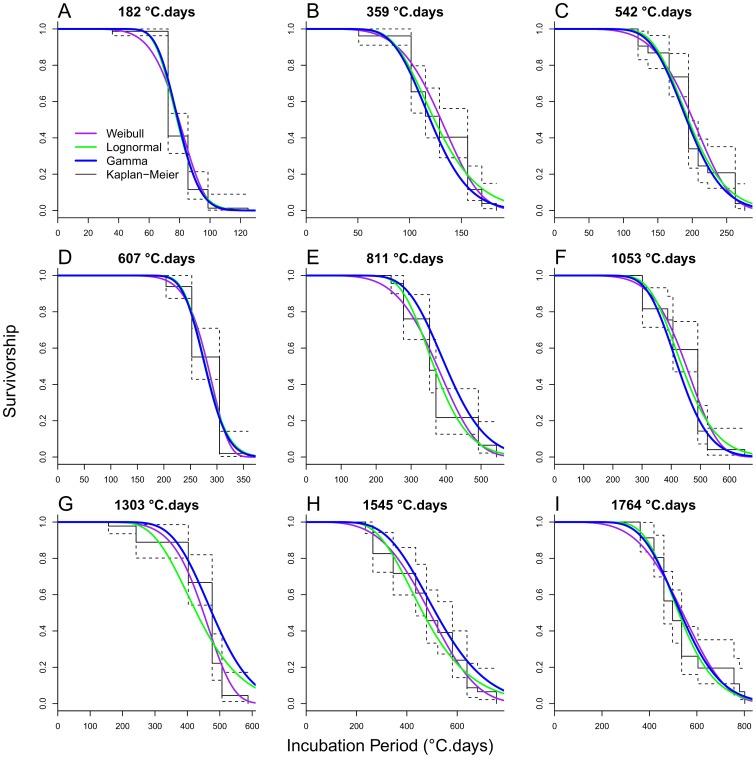
Figure 4. Survivorship of the distribution models fitted to the incubation period data by host age.
Gamma (blue line) Lognormal (green), Weibull (purple), and estimated non-parametric Kaplan-Meier (black) survival function. Age of host plants at inoculation: (A) 18 days (182°C.days), (B) 32 days (359°C.days), (C) 46 days (542°C.days), (D) 60 days (607°C.days), (E) 74 days (811°C.days), (F) 88 days (1053°C.days), (G) 102 days (1303°C.days), (H) 116 days (1545°C.days),and (I) 130 days (1764°C.days).

