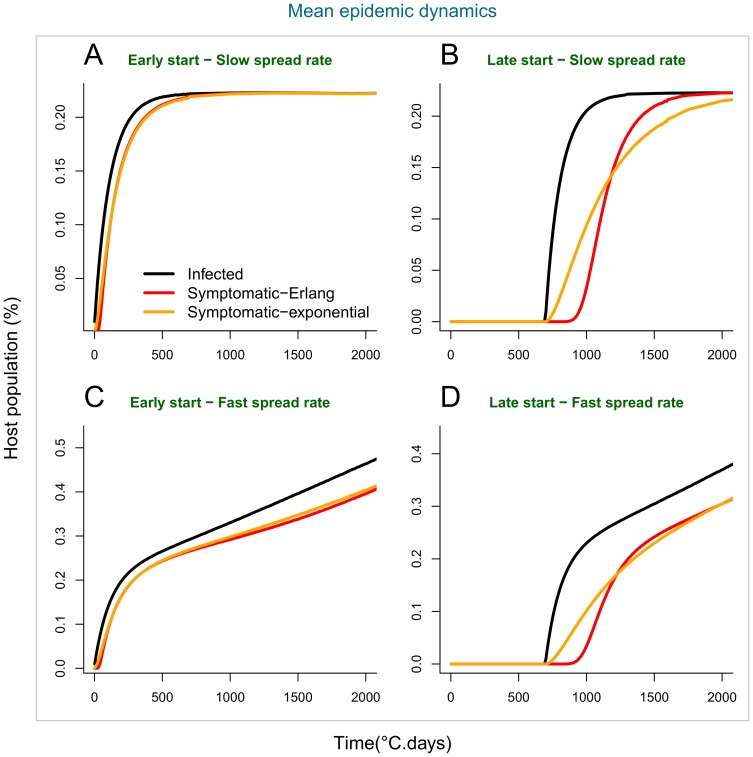
Figure 9. Mean epidemic dynamics of cryptic infections and disease symptoms in populations.
Mean epidemic dynamics of cryptic infections (black) and above-ground disease symptoms in populations with differing incubation period distributions: Erlang (red) and exponential (orange). A-B-C & D compare the mean of the distribution of stochastic epidemics at each time point in Figures 7 and 8. Late epidemics show a considerable lag in symptomatic infections relative to cryptic infections that depends on the assumed distribution of the incubation period.

