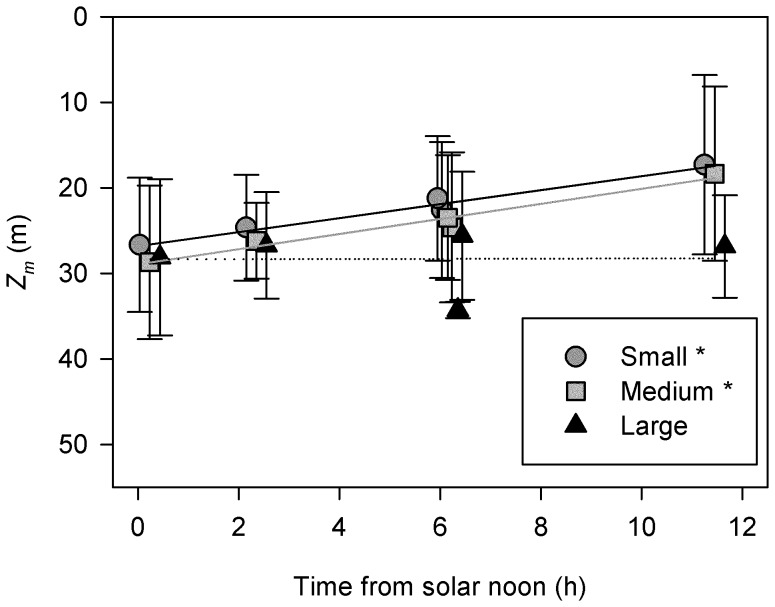
Figure 5. Test of the hypothesis of no migration.
Weighted mean depth Zm of small, medium and large Mnemiopsis leidyi as a function of time from solar noon at Anholt 24-hour station, where the latter was used as a proxy for the daily variation in surface light intensity. Error bars are the spread Zs (m) around the mean depth. The lines are the linear regressions (Table 2), where the asterisk indicates statistical significance. The symbols are slightly shifted to facilitate readability.

