
Figure 7. Predator and prey overlap.
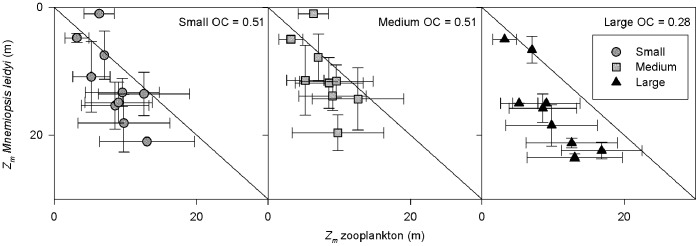
Weighted mean depth Zm (error bars Zs) of three size classes of Mnemiopsis leidyi plotted against the weighted mean depth of their potential zooplankton prey. OC = overlap coefficient (averaged over all stations) where a value of 1 indicates full vertical overlap, and 0 no vertical overlap. M. leidyi mean depth is based on the same maximum depth as the zooplankton.