
Figure 3. Growth and ethanol production of xylan-adapted populations and the founder.
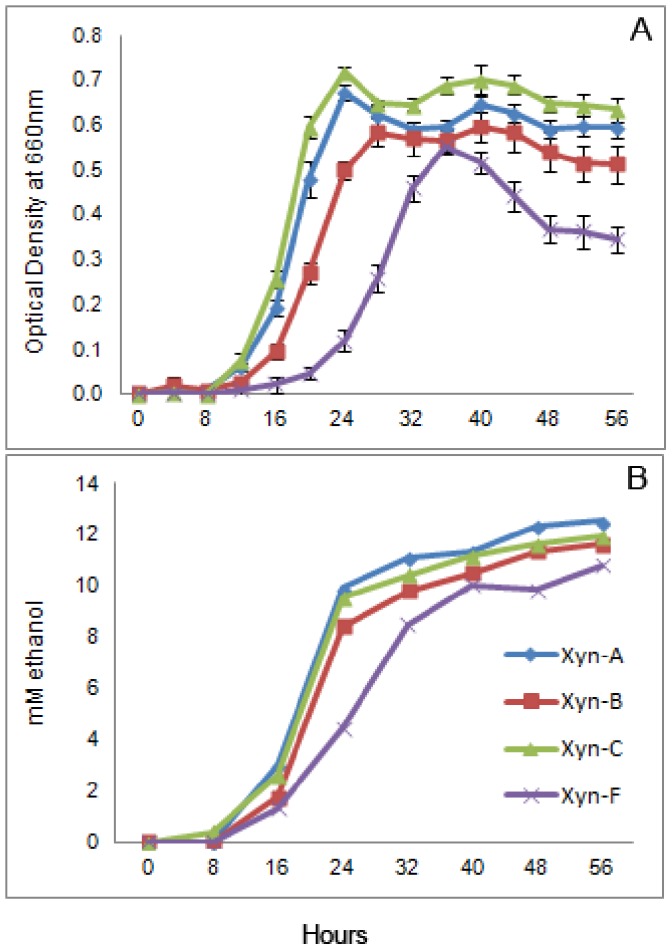
Growth (A) was measured every four hours as change in optical density in a spectrophotometer. Supernatant was collected every eight hours for measuring ethanol production (B) rates. Ethanol values are an average of two independent samples.