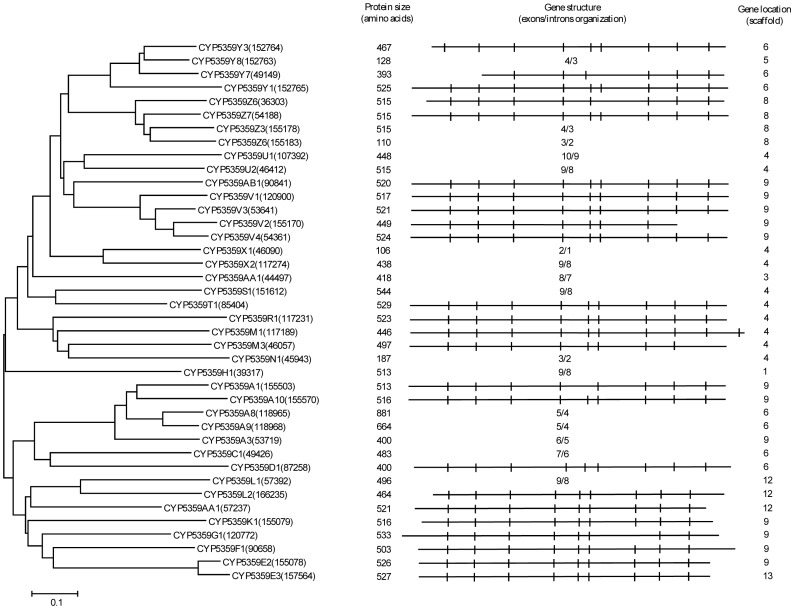
Figure 12. Phylogenetic and gene-structure analysis of CYP5359 family.
Forty CYP5359 P450 sequences from Ganoderma sp. were included in the tree. A minimum evolution tree was constructed using the close-neighbor-interchange algorithm in MEGA (version 5.05). The protein size in amino acids is shown in the figure. The gene-structure analysis for each P450 was presented in the form of exon-intron organization. A graphical format showing parallel (gene size) and vertical lines (introns) is presented for P450s showing similar gene structure. For the rest of the P450s, the number of exons and introns was shown. The genetic location of P450 is shown in the form of the scaffold number.

