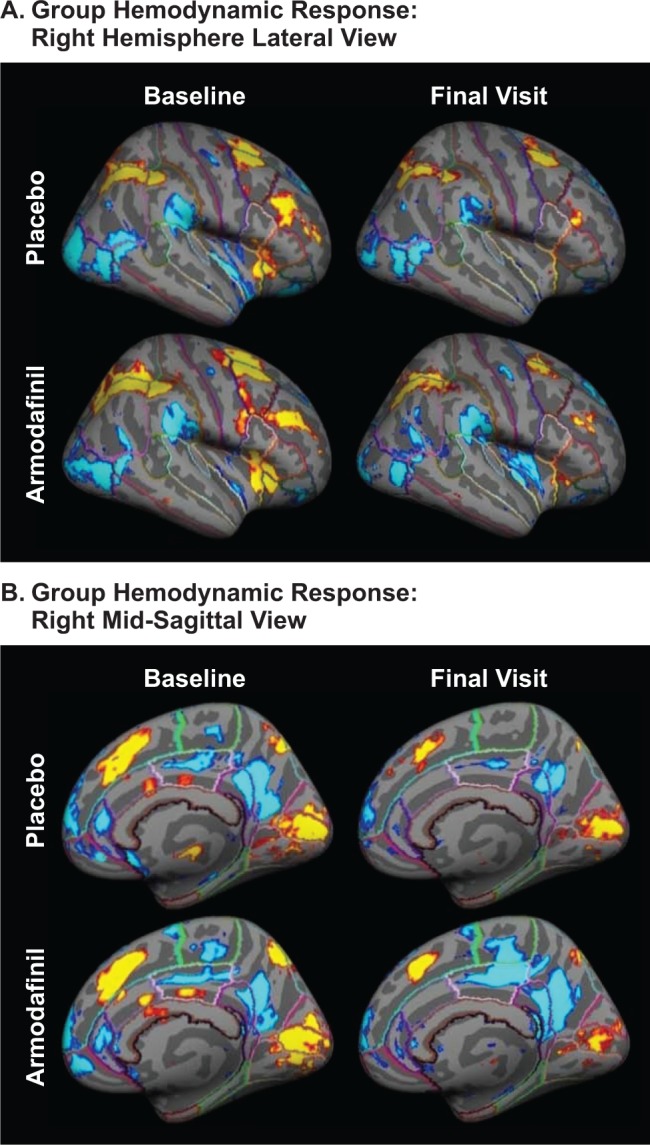
Figure 4. Significance maps of the 2-back vs. sustained attention task contrast at baseline and final visit for each group.

(A) Group hemodynamic response: right hemisphere lateral view. (B) Group hemodynamic response: right mid-sagittal view. The maps are thresholded at p < 0.01 (uncorrected for multiple comparisons). Red/ yellow indicates that the amplitude of the 2-back hemodynamic response was greater than that of sustained attention task; blue/cyan indicates the opposite polarity.
