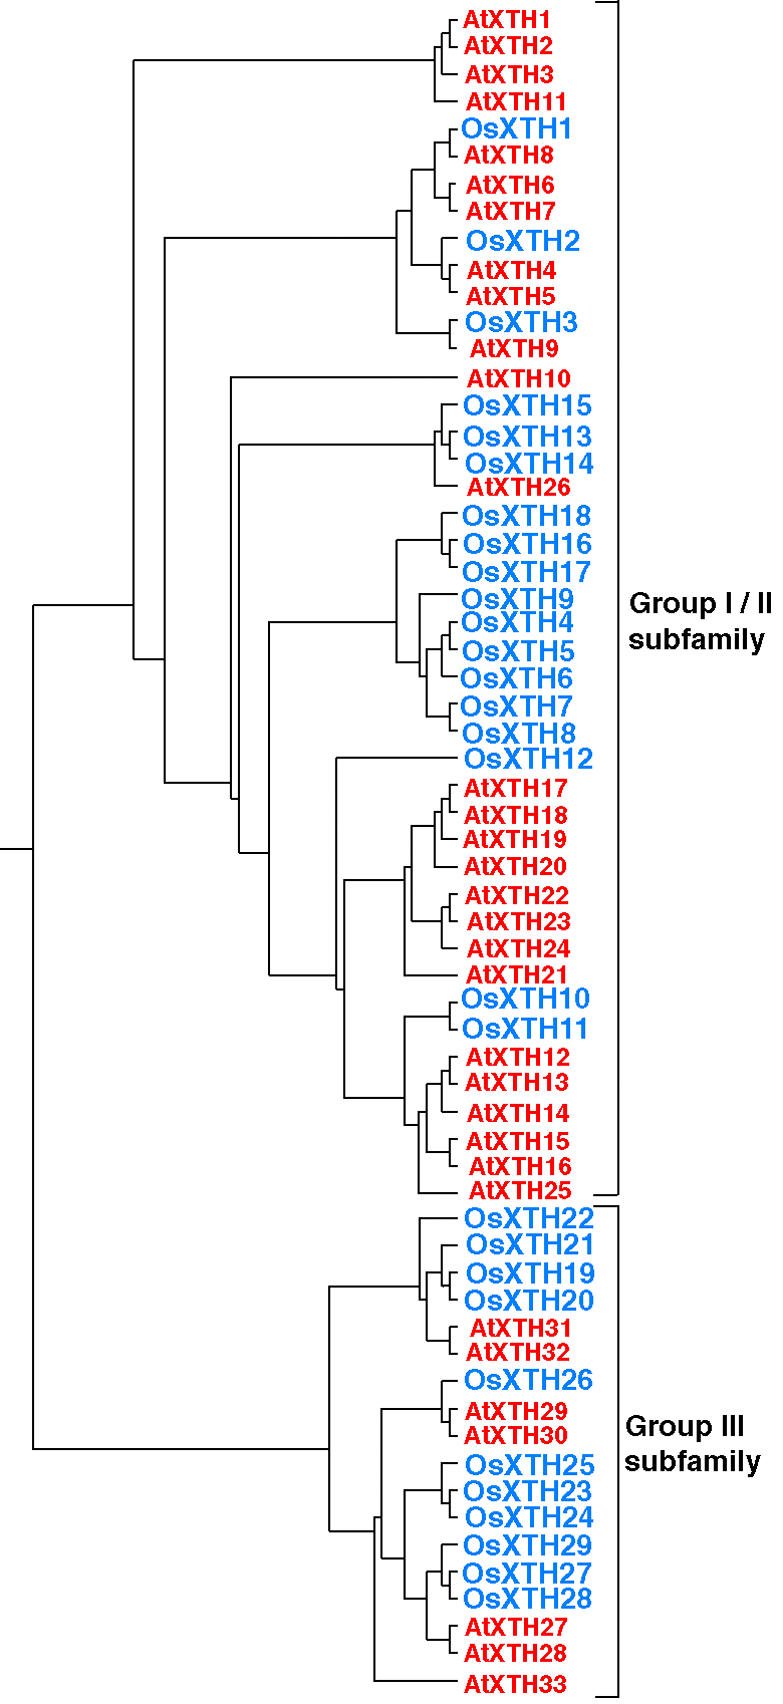
Figure 2.

Dendrogram generated using ClustalW and TreeViewPPC software, based on the predicted amino acid sequences of AtXTHs and OsXTHs, which are shown in red and blue, respectively. The XTH members are classified into two subfamilies based on the classification for Arabidopsis XTH genes in which the AtXTH members are classified into three groups (Yokoyama and Nishitani, 2001b).
