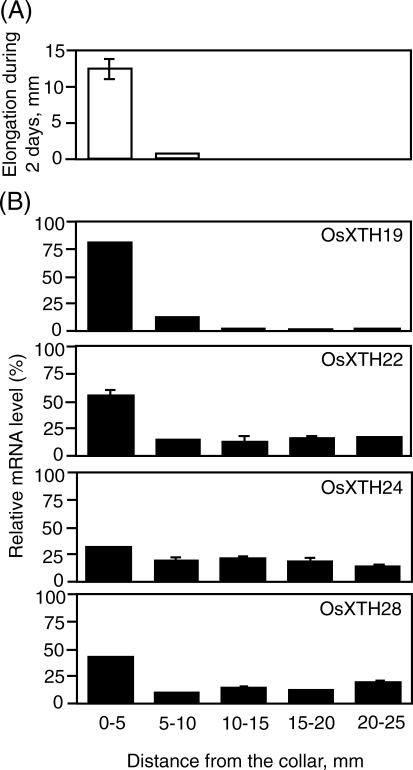
Figure 6.
Expression profiles of four OsXTH genes along the third leaf in 14-d-old plants. A, Elongation of each region of the leaves during a 2-d period. B, Transcript levels of the four genes in individual regions along the third leaf as measured by quantitative real-time RT-PCR analysis. The relative abundance of individual mRNAs in each region is shown as percentages of the total copy number in the whole leaf. Error bars = se based on three replicates of the same sample.

