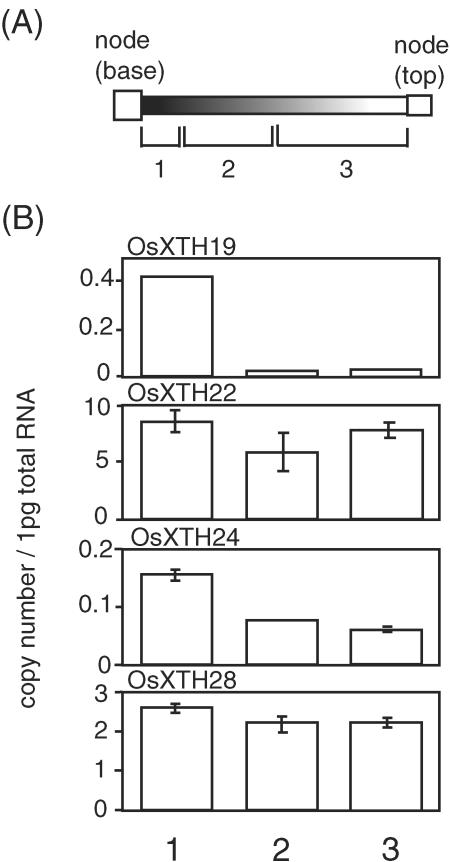
Figure 7.
Expression profiles of four OsXTH genes along the internodes in 12-week-old plants. A, Schematic description of the three zones, defined as: 1, the dividing/elongating zone with intercalary meristem; 2, premature nonelongating zone; and 3, mature nonelongating zone (Uozu et al., 2000). B, Transcript levels of the four OsXTH genes in regions of the internodes as determined by quantitative real-time RT-PCR. The transcript levels are shown as the number of RNA molecules in 1 pg of total RNA from each sample. Error bars = se based on three replicates of the same sample.

