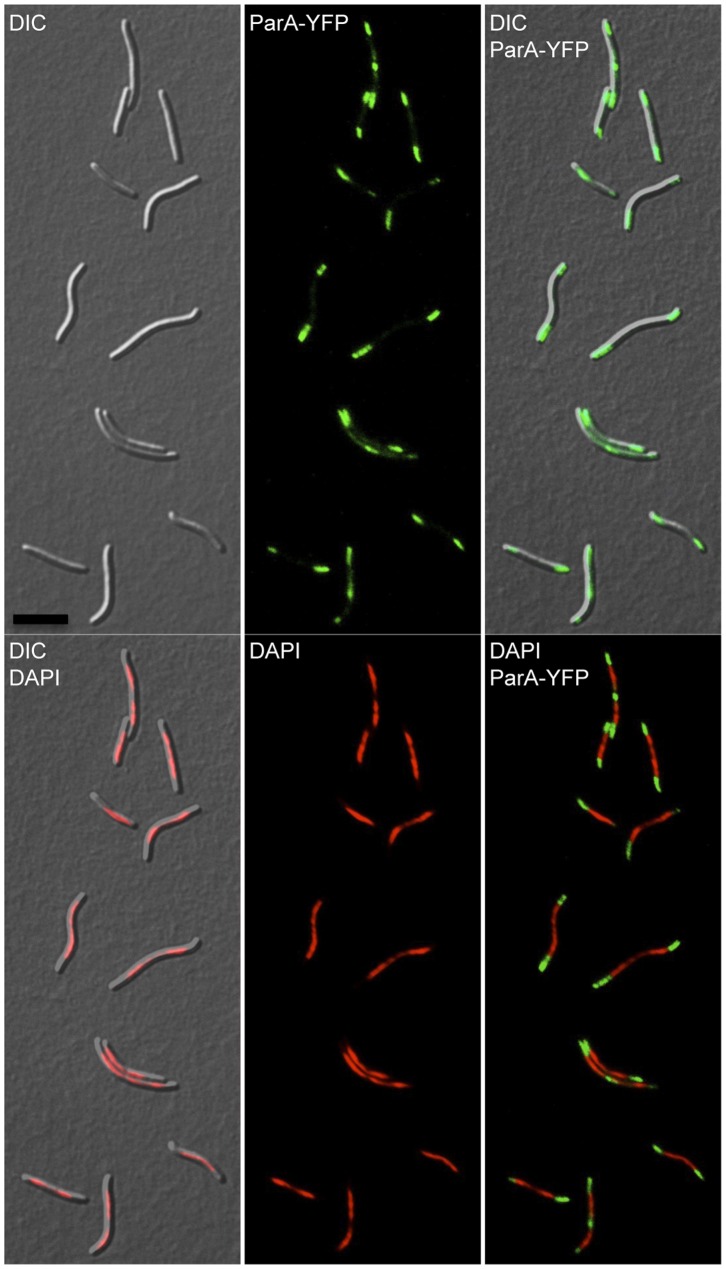
Figure 5. Subcellular localization of ParA in M. xanthus.
Fluorescence microscope images of cells from the strain Pvan-parA-yfp (MR2504) grown without vanillate. DIC (top left), ParA-YFP fluorescence (top middle, in green), merged DIC with ParA-YFP fluorescence (top right), merged DIC with DAPI fluorescence (bottom left), DAPI fluorescence (bottom middle, in red), and merged DAPI (in red) with ParA-YFP (in green). Black scale bar represents 10 µm.

