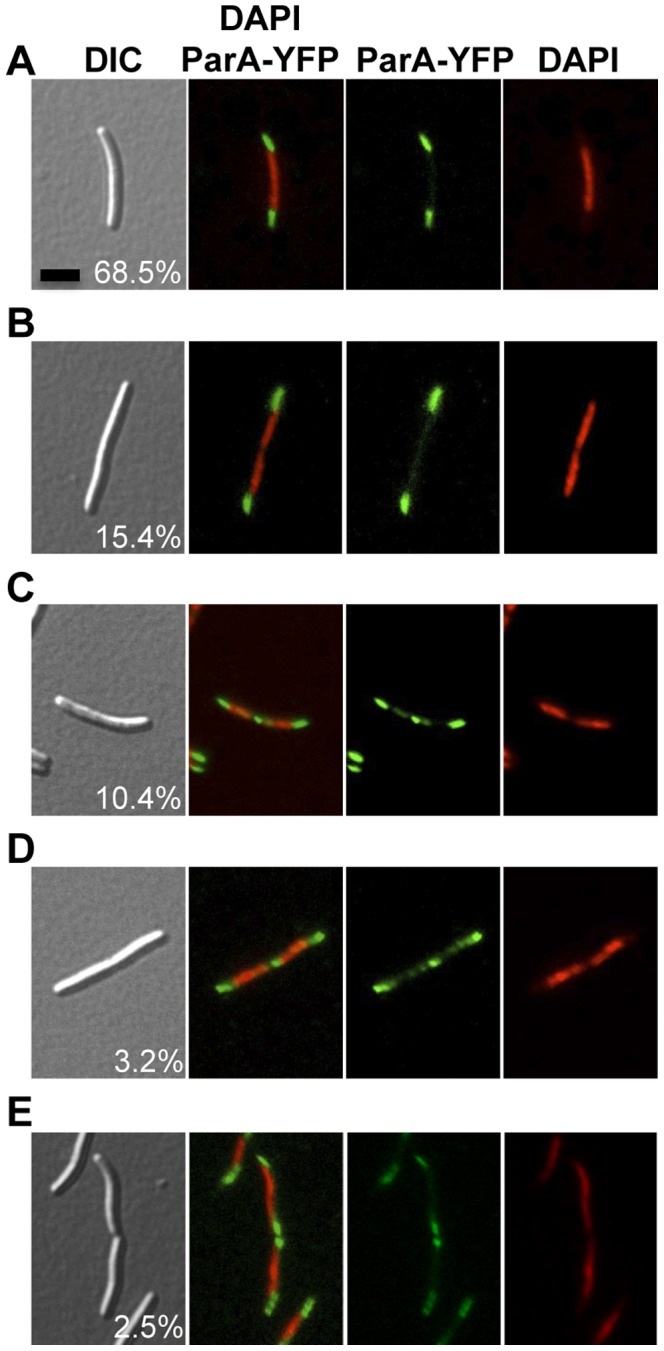
Figure 6. Distribution of cells according to its ParA localization.

DIC, ParA-YFP (in green), and DAPI (in red) microscope fluorescence images of cells from the strain Pvan-parA-yfp (MR2504) grown without vanillate. Black scale bar represents 5 µm. A total of 615 cells from three independent experiments were examined and the mean and the standard deviation are reported. (A) A representative cell with two polar clusters of ParA-YFP and one chromosomal mass (68.5±10.2%). (B) Cell having two polar clusters of ParA-YFP and two distinct chromosomal masses (15.4±8.7%). (C) Representative cell with two polar clusters of ParA-YFP, two distinct chromosomal masses, and an additional cluster of ParA-YFP in the cell division plane but with no pinch in its cellular morphology (10.4±2.3%). (D) Same as in (C) but with incipient constriction along the cell division plane (3.2±0.7%). (E) Cells recently divided, showing two polar clusters of ParA-YFP and one chromosomal mass, in each of the two cells (2.5±1.4%).
