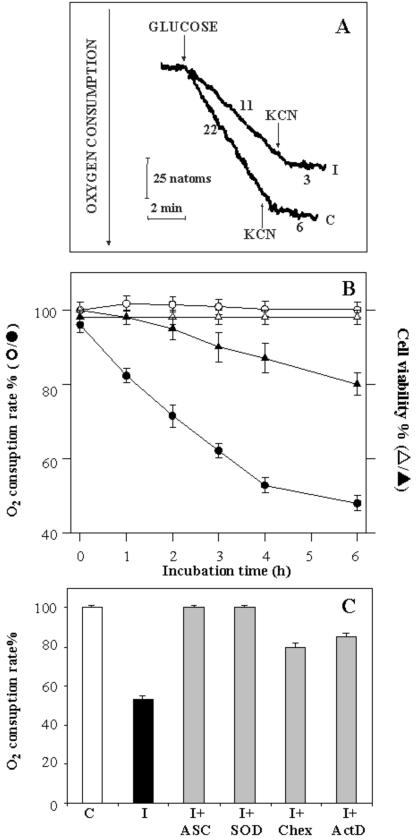
Figure 10.
Oxidation of Glc in PCD-induced cells. A, Control and 4-h PCD cells (0.2 mg of protein) were incubated at 25°C in 1.5 mL of the medium reported in “Materials and Methods”. At the arrows, Glc (10 mm) and KCN (1 mm) were added. The rate of oxygen uptake is expressed as nanoatoms of oxygen per minute per milligram of cell protein. B, Consumption of O2 was monitored polarographically in 0- to 6-h PCD cells, as reported in Figure 10A. The rate of Glc-dependent oxygen consumption and the viability of both control (white symbols) and PCD (black symbols) cells were measured as a function of time and expressed as a percentage of the control. C, Glc-dependent rate of oxygen consumption was measured 4 h after heat shock in the absence (I) or in the presence of 0.4 mm ASC (I+ASC), 75 units mL-1 SOD (I+SOD), 50 μg mL-1 Chex (I+Chex), or 10 μg mL-1 ActD (I+ActD). The rate of O2 consumption measured in control cells (C) was set at 100. For B and C, values represent the mean (±se) of three experiments.

