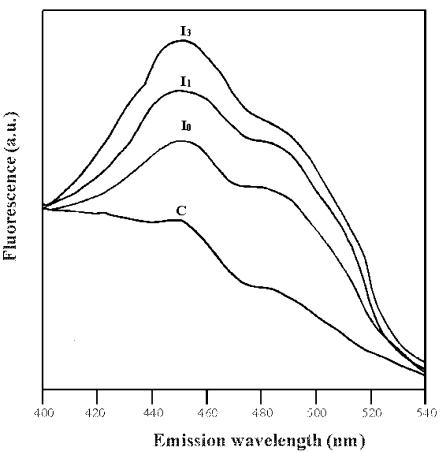
Figure 11.
Fluorescence emission spectra of control and PCD cells. Fluorescence emission spectra (λexc=334; emission: 400 < λ < 540) of TBY-2 cells (0.2 mg protein) were measured immediately (I0), 1 h (I1), and 3 h (I3) after the heat shock and compared with the control (C). The experiment was repeated four times with different cell preparations, giving values with 5% to 10% variation. Fluorescence intensity is reported in arbitrary units (a.u.).

