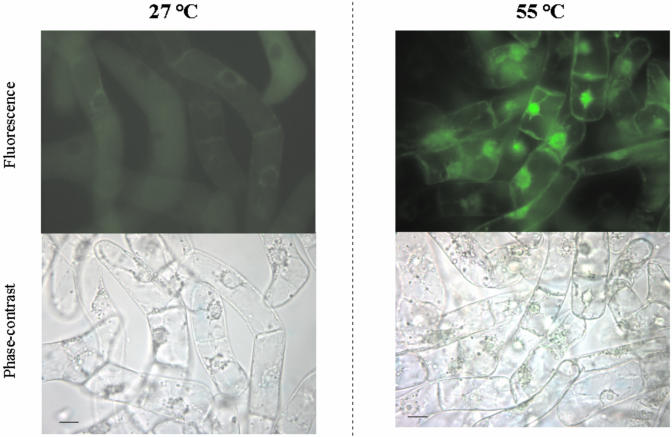
Figure 4.
Production of H2O2 in PCD-induced cells. TBY-2 cells were kept either at 27°C or taken immediately after heat shock at 55°C. The cells were stained with DHR123, and H2O2 production was visualized by fluorescent microscopy as described in “Materials and Methods.” Cells were photographed under both fluorescent field and phase contrast. Pictures represent typical examples. Bar = 20 μm.

