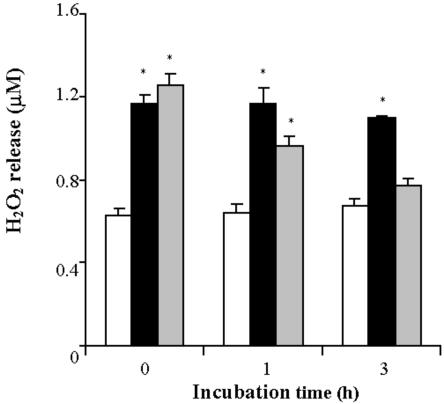
Figure 5.
Release of H2O2 into the culture medium by TBY-2 cells. The concentration of H2O2 was measured in the absence (black columns) or in the presence of 0.4 mm ASC (gray columns) added to the culture medium before heat shock. The concentration of H2O2 in control cells (white columns) was also measured. At the indicated times, 1 mL of cell suspension (0.12 g of cells) was taken, and the concentration of H2O2 was determined in the medium as described in “Materials and Methods.” Values represent mean (±se) of five experiments. An asterisk indicates the values that are significantly different from the control (P < 0.01).

