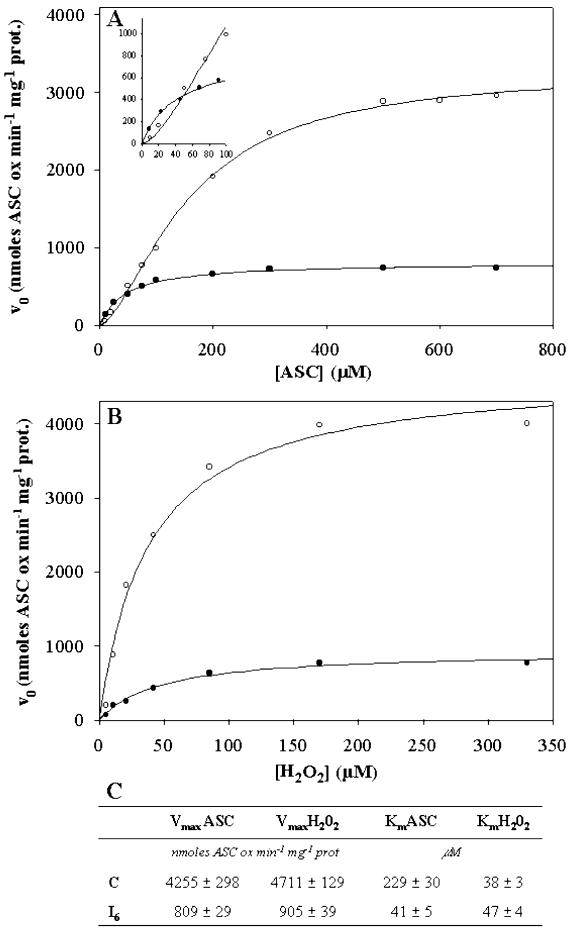
Figure 9.
Kinetic behavior of cAPX in control and PCD cells. The analysis was performed in extracts from control cells (○) and from cells 6 h after the heat shock (•). A, Concentration of H2O2 was 170 μm, and the concentration of ASC was varied over the range 10 to 700 μm. B, Concentration of ASC was 500 μm, and the concentration of H2O2 was varied over the range 5.5 to 330 μm. C, Vmax and Km values for ASC and H2O2 in control and heat-shocked cells. Values represent the mean (±se) of five experiments.

