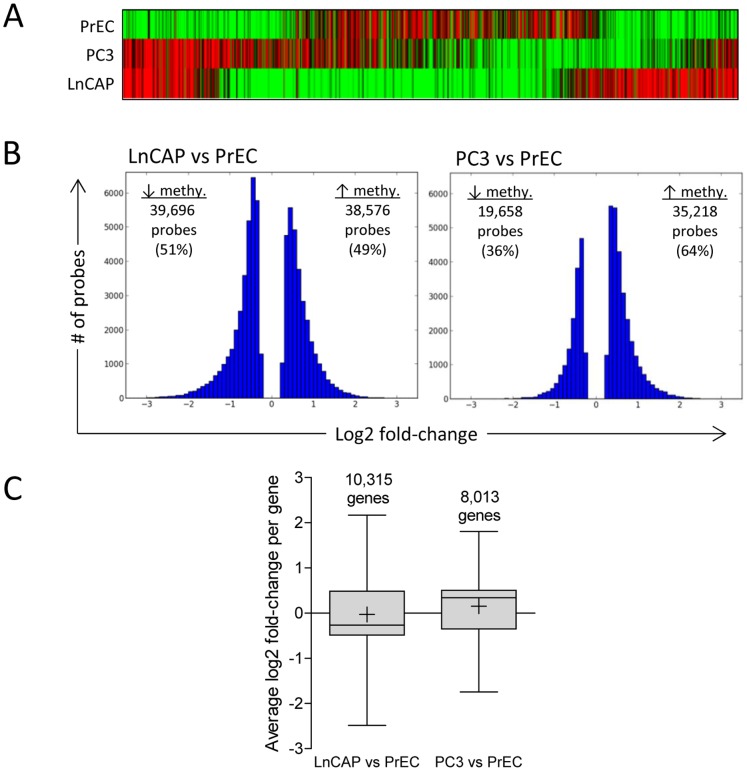
Figure 2. Genome-wide promoter methylation profiling comparing normal prostate epithelial cells and prostate cancer cells.
(A) Hierarchical clustering analysis of probes with significant scaled log2 ratio in PrEC, LnCAP, and PC3 cells. Green and red bars represent individual probes with significant decreased and increased methylation, respectively, of MeDIP DNA samples relative to input DNA samples. Data represent the top 1,000 most significant probes within each cell line. (B) A comparison of methylation changes in LnCAP and PC3 cells relative to PrEC cells. Significant methylated probes in LnCAP and PC3 cells were compared to PrEC, and the distribution of probes with significant log2 fold-changes are shown. (C) Average methylation level in individual genes in LnCAP and PC3 cells compared to PrEC. Log2 fold-change per gene was determined by averaging the log2 fold-change of all differentially methylated probes assigned to each gene, and represented as box and whisker plots. Number above the bar denotes the number of genes in each group. Whiskers represent maximum and minimum values, and “+” represents mean value.

