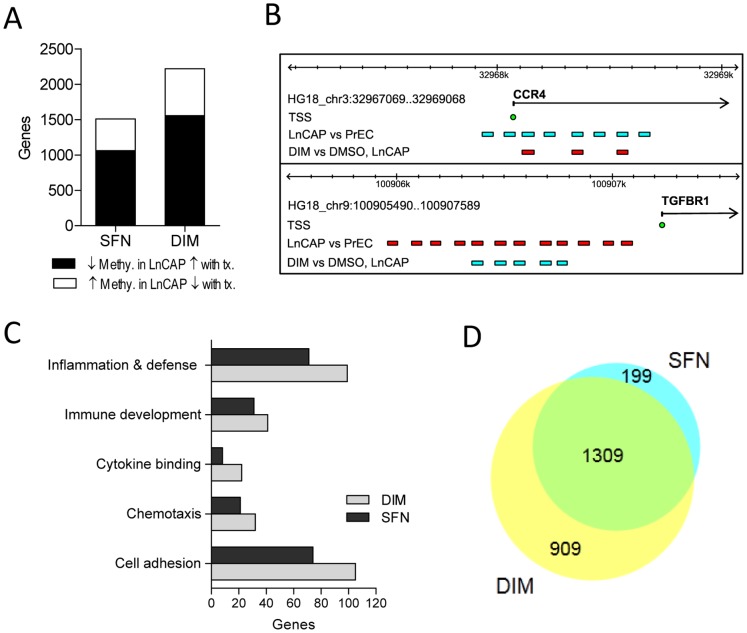
Figure 6. Functional annotation of genes with altered promoter methylation in LnCAP cells that were reversed with SFN and/or DIM treatments.
(A) Number of differentially methylated genes in LnCAP cells relative to PrEC cells that were reversed with SFN or DIM treatments. Black bar represents genes that had decreased methylation in LnCAP cells that were increased with SFN/DIM treatments. White bar represents genes that had increased methylation in LnCAP cells that were decreased with SFN/DIM treatments. (B) Two gene examples, CCR4 and TGFBR1, with dysregulated methylation profiles in LnCAP cells that were reversed with SFN and/or DIM treatments. Colored bars represent the genomic position of DNA methylation probes that had decreased methylation (blue) or increase methylation (red) when comparing the probe-specific log2 fold-change in LnCAP cells versus PrEC, or DIM versus DMSO vehicle control in LnCAP cells. TSS (blue circle) represents transcription start site of each gene. (C) Functional annotation of differentially methylated gene targets in LnCAP cells that were reversed with SFN or DIM treatments. (D) Venn diagram showing the number of gene targets with promoter methylation that were dysregulated in LnCAP cells and reversed with SFN or DIM.

