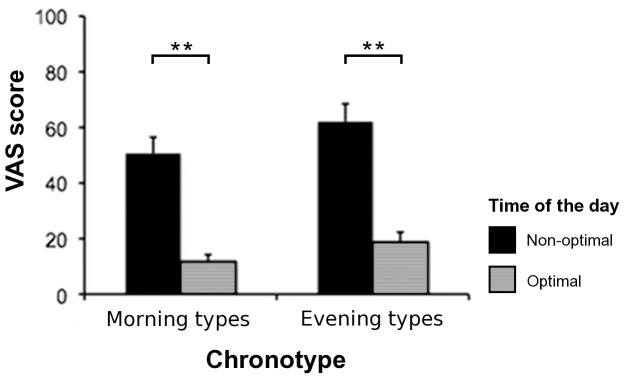
Figure 1. Mean visual analogue scale (VAS) fatigue scores.

Mean VAS scores reflect subjective fatigue of the participants according to their chronotype (morning or evening types) and the time of the day (non-optimal or optimal). Error bars represent the standard error of the mean (SEM). Asterisks depict significant post-hoc tests (**p<.01).
