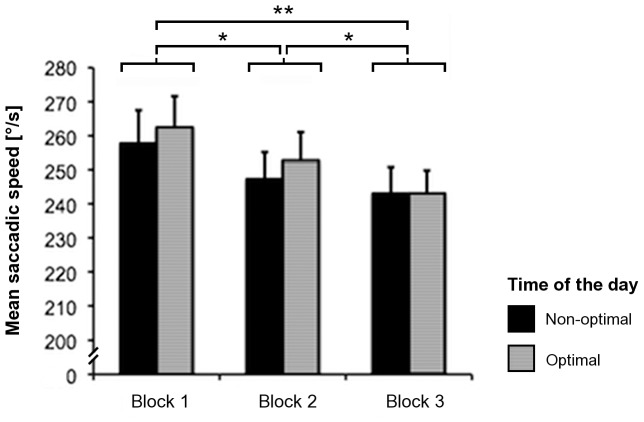
Figure 4. Mean saccadic speed.
Mean saccadic speed in the three blocks of the free visual exploration task, as measured at optimal and non-optimal times of the day for the participants. Error bars represent the standard error of the mean (SEM). Asterisks depict significant post-hoc tests (*p<.05; **p<.01).

