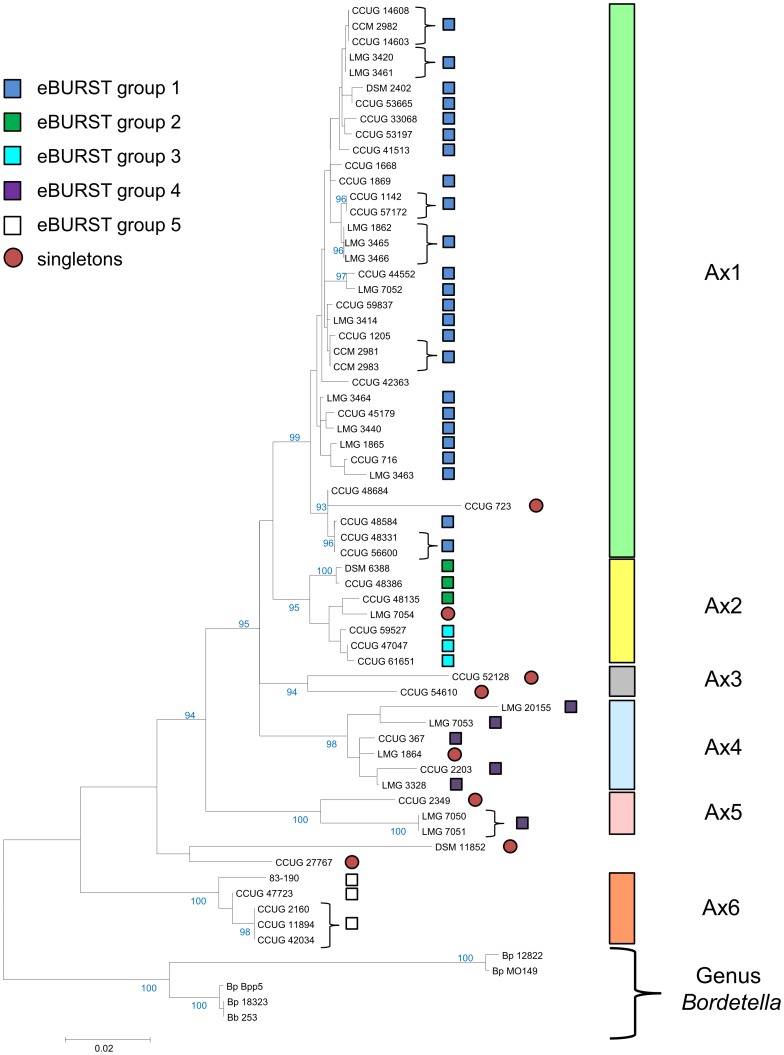
Figure 1. Molecular and phenotypic characterization of the Achromobacter isolates.
The tree with the highest log likelihood is shown. The percentage of trees in which the associated taxa clustered together, as determined by 500 bootstrap replicates, is shown next to the branches. Only values above 90% are shown. The tree is drawn to scale, with branch lengths measured in the number of substitutions per site. Vertical colored bars indicate robust clades with bootstrap support >90%. Brackets indicate strains that are identical throughout the four partially sequenced genes. Strains that are marked by squared rectangles of the same color belong to the same eBURST group, i.e., share at least one identical locus (gene). Red circles indicate so-called singletons which do not share an identical locus with any of the other strains.

