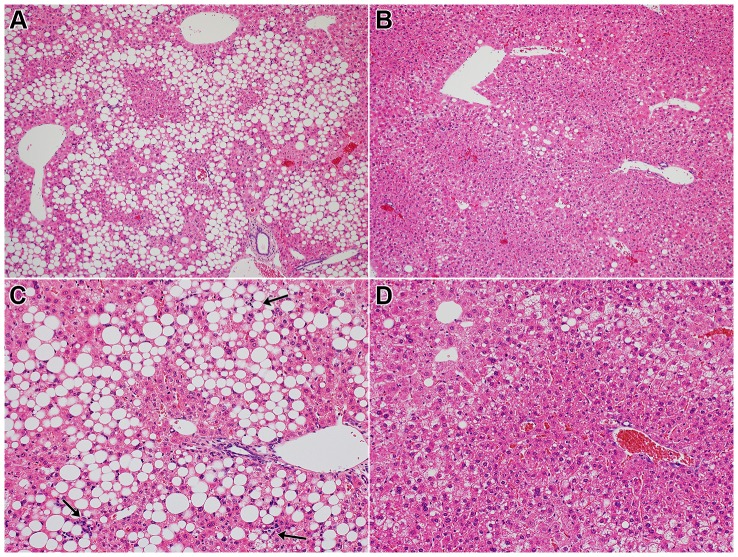
Figure 1. Photomicrographs of the liver.
Mice of the MCD group show marked hepatic steatosis (A), but steatosis is suppressed in mice of the TJ-48 group (B). Necroinflammatory foci (arrows) are scattered in the liver of mice of the MCD group (C), but lobular inflammation is suppressed in mice of the TJ-9 group (D). (Hematoxylin and eosin stain; A and B: ×100; C and D: ×200).

