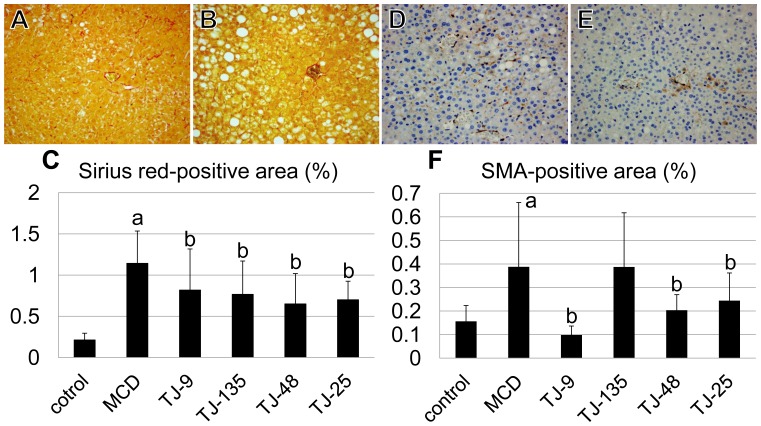
Figure 2. The frequency of Sirius red-positive and SMA-positive area.
(A-C) The frequency of Sirius red-positive area is significantly higher in the MCD group than in the control group, and significantly lower in all the JHM groups than in the MCD group. The Sirius red-positive area is very small in the control group. (A: photomicrograph of a mouse of the MCD group, B: photomicrograph of a mouse of the TJ-48 group, ×400) (D–F) The rate of the SMA-positive area is significantly higher in the MCD group than in the control group, and significantly lower in the TJ-9, TJ-48, and TJ-25 groups than in the MCD group. (D: photomicrograph of a mouse of the MCD group, E: photomicrograph of a mouse of the TJ-9 group, ×400). aSignificantly different from the control group (P<0.05). bSignificantly different from the MCD group (P<0.05).

