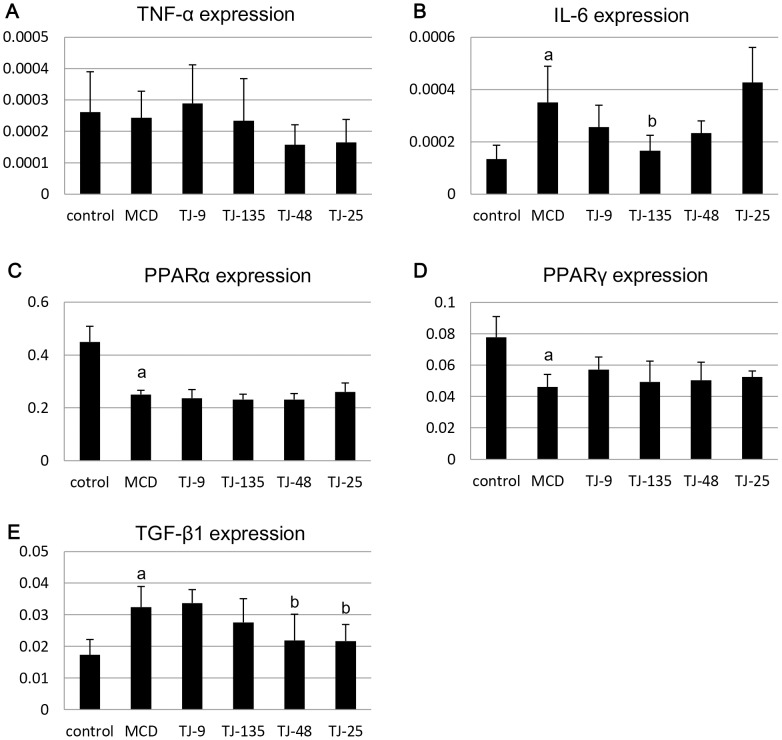
Figure 3. Expression levels of cytokine and receptor genes in the liver.
TNF-α expression levels are lower in the TJ-48 and TJ-25 groups than in the MCD group (A). IL-6 expression levels are significantly higher in the MCD group than in the control group; they are lower in the TJ-9, TJ-135, and TJ-48 groups than in the MCD group, and the difference is statistically significant for the TJ-135 group (B). Although PPARα expression levels are significantly lower in the MCD group than in the control group, they are not influenced by JHM supplementation (C). PPARγ expression levels are significantly lower in the MCD group than in the control group; they are higher in all the JHM groups (especially in the TJ-9 group) than in the MCD group (D). TGF-β1 expression levels are significantly higher in the MCD group than in the control group, and significantly lower in the TJ-48 and TJ-25 groups than in the MCD group (E). aSignificantly different from the control group (P<0.05). bSignificantly different from the MCD group (P<0.05).

