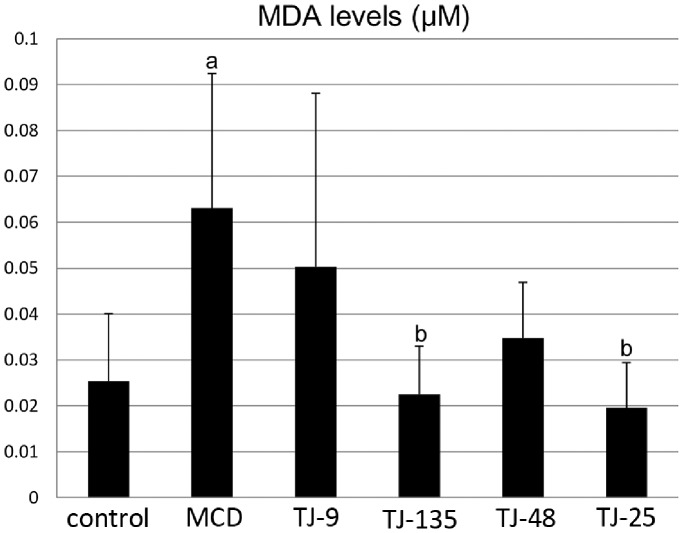
Figure 4. MDA levels in the liver.
MDA levels are significantly higher in the MCD group than in the control group; they are lower in all the JHM groups than in the MCD group, and the differences are statistically significant for the TJ-135 and TJ-25 groups. aSignificantly different from the control group (P<0.05). bSignificantly different from the MCD group (P<0.05).

