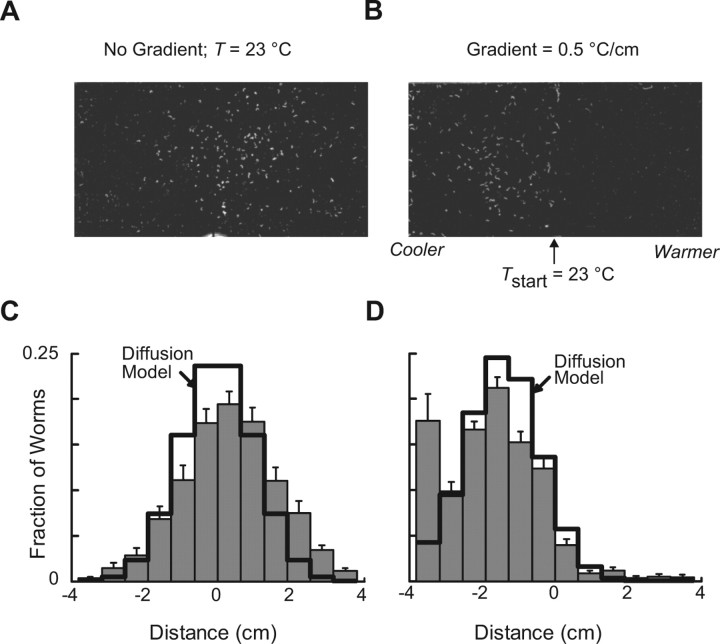
Figure 3.
Diffusion with drift captures the essential features of the response to spatial thermal gradients. A, B, Representative distributions of worms conditioned at 20°C and exposed to constant temperature (23°C) (A) or a 0.5°C/cm gradient (B) for 10 min. Images are scans of assay plates; bright white spots are worms. C, D, Average distributions of worms conditioned at 20°C and exposed to constant temperature (23°C) (C) or a 0.5°C/cm gradient (D) for 10 min. Gray bars are the mean ± SEM (n = 6 assays). Solid black lines were calculated from a simple diffusion with drift model, as described in Results.

