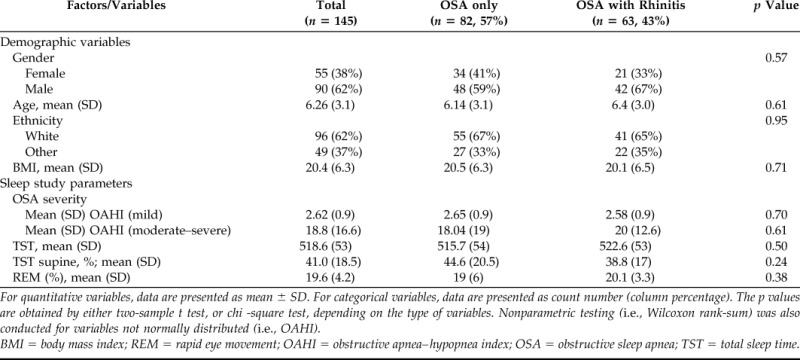
Table 1.
Demographic and polysomnographic profile of subjects

For quantitative variables, data are presented as mean ± SD. For categorical variables, data are presented as count number (column percentage). The p values are obtained by either two-sample t test, or chi -square test, depending on the type of variables. Nonparametric testing (i.e., Wilcoxon rank-sum) was also conducted for variables not normally distributed (i.e., OAHI).
BMI = body mass index; REM = rapid eye movement; OAHI = obstructive apnea–hypopnea index; OSA = obstructive sleep apnea; TST = total sleep time.
