. 2011 Mar 5;21(2):132–143. doi: 10.2188/jea.JE20100098

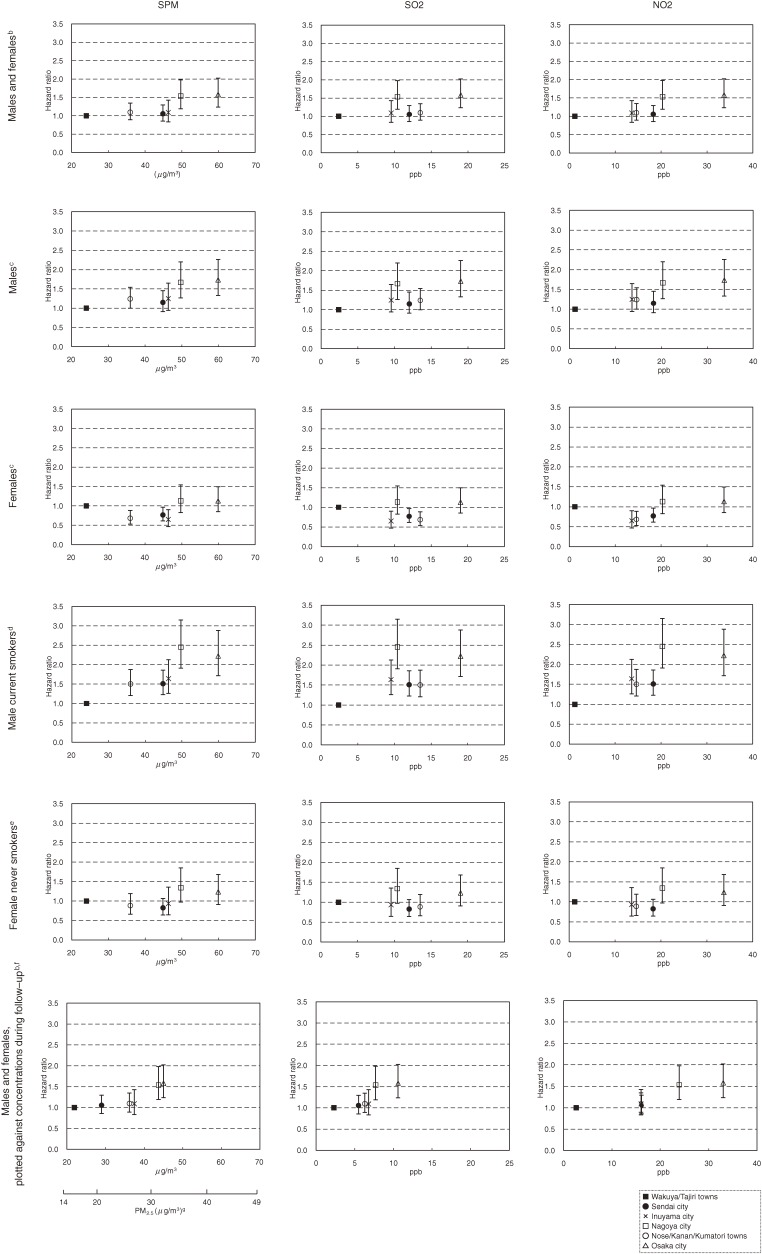
Figure 3. Adjusted hazard ratios for lung cancer mortality in the 6 study areas, plotted against average air pollutant concentrations.a NO2, nitrogen dioxide; PM2.5, particulate matter <2.5 µm in aerodynamic diameter; SO2, sulfur dioxide; SPM, suspended particulate matter. a10-year average concentrations (1974–1983) before the baseline survey are used as the horizontal axis, unless otherwise specified. Hazard ratios were calculated using Wakuya/Tajiri towns as a reference. Vertical bars indicate the 95% confidence intervals of the hazard ratios. bAdjusted for sex, age (continuous), smoking status (current, former, or never), pack-years (0 to <10, 10 to <20, ≥20), smoking status of family members (current smoking/no current smoking), daily green and yellow vegetable consumption (yes/no), daily fruit consumption (yes/no), and indoor charcoal or briquette braziers used for heating (yes/no). cAdjusted for age (continuous), smoking status (current, former, or never), pack-years (0 to <10, 10 to <20, 20 to <30, 30 to <40, ≥40 for men; 0 to <10, 10 to <20, ≥20 for women), smoking status of family members (current smoking/no current smoking), daily green and yellow vegetable consumption (yes/no), daily fruit consumption (yes/no), and indoor charcoal or briquette braziers used for heating (yes/no). dAdjusted for age (continuous), pack-years (0 to <10, 10 to <20, 20 to <30, 30 to <40, ≥40), smoking status of family members (current smoking/no current smoking), daily green and yellow vegetable consumption (yes/no), daily fruit consumption (yes/no), and indoor charcoal or briquette braziers used for heating (yes/no). eAdjusted for age (continuous), smoking status of family members (current smoking/no current smoking), daily green and yellow vegetable consumption (yes/no), daily fruit consumption (yes/no), and indoor charcoal or briquette braziers used for heating (yes/no). f10-year average concentration (1984–93) during the follow-up period was used as the horizontal axis. gEstimated by multiplying the level of SPM by 0.7.

Figure 3.