


Figure 2.
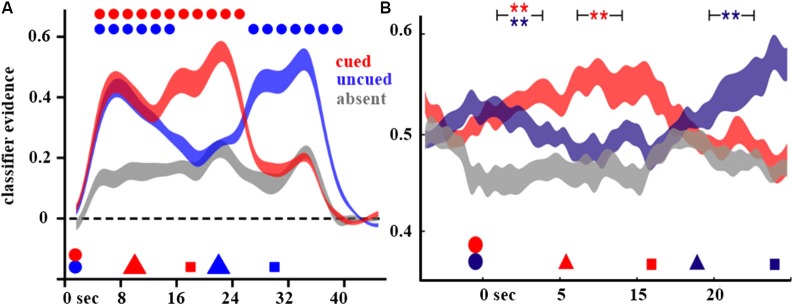
Decoding of attended and UMIs. Shown are the decoding results from Lewis-Peacock et al. (2012) (A) and LaRocque et al. (2013) (B) on cue-switch trials. In both figures, classifier evidence for the stimulus category is plotted as a function of time, with the timing of events in the trial indicated by geometric shapes on the x-axis (circles indicate stimulus presentation, triangles indicate the cues, and squares indicate the memory probes). The color scheme indicates the categories with respect to the cues: cued (red) is the category indicated by the first cue, uncued (blue) is the category of the other stimulus which is not selected by the first cue, and absent (gray) is the category not present on that trial.