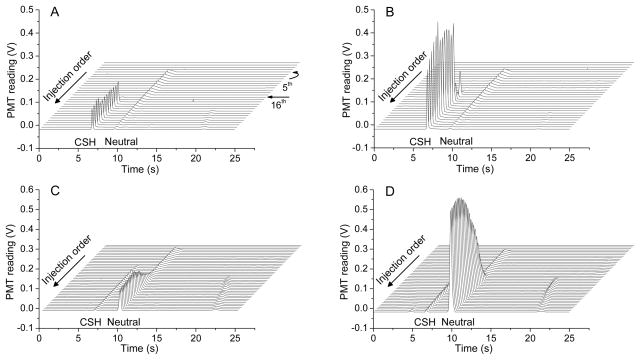
Figure 3.
Electropherograms obtained from experiments performed on the microfluidic chip coupled with online electroosmotic perfusion in the CA3 region of the OHSCs. Electropherograms in each plot are obtained from a single run. The peak labeled “CSH” is from the adduct of CSH with ThioGlo-1. Neutral compounds (unreacted ThioGlo-1 and pantetheine) are eluted as a single neutral peak. Separation conditions are described in experimental section. Initial cystamine or pantethine concentrations in the perfusate are (A) cystamine: 3.6 μM; (B) cystamine: 12 μM; (C) pantethine: 1.0 mM; (D) pantethine: 8.0 mM.

