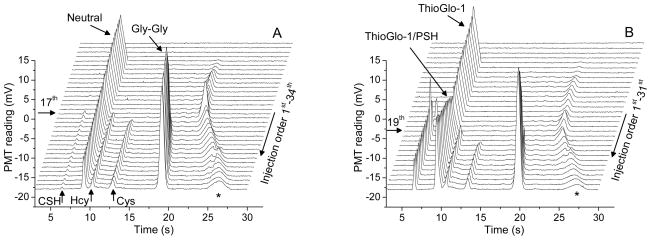
Figure 5.
Series of electropherograms obtained in two experiments performed on the microfluidic chip coupled with online electroosmotic perfusion in the CA3 region of the OHSCs. Initial CoA concentrations in the perfusate ggACSF are (A) 0 mM; (B) 0.12 mM. Peaks labeled with cysteamine (CSH), pantetheine (PSH), homocysteine (Hcy), cysteine (Cys) and glycylglycine (Gly-Gly) on the plots are all products from derivatizing reaction with ThioGlo-1. Peaks marked with ‘*’ are impurity in the dye. Separation conditions are described in experimental section.

