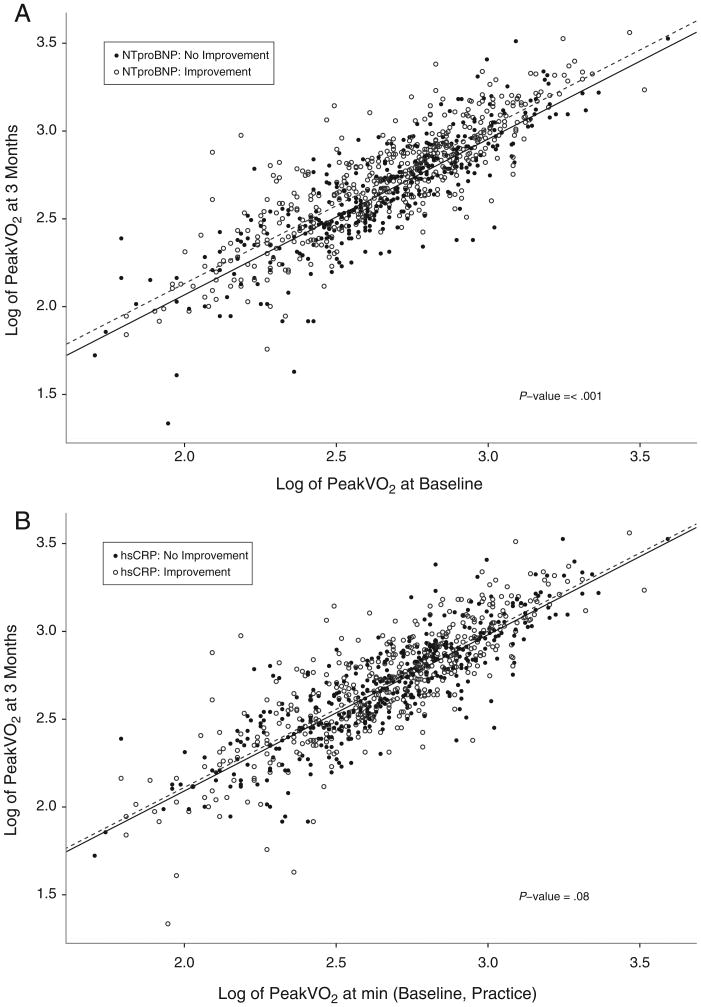
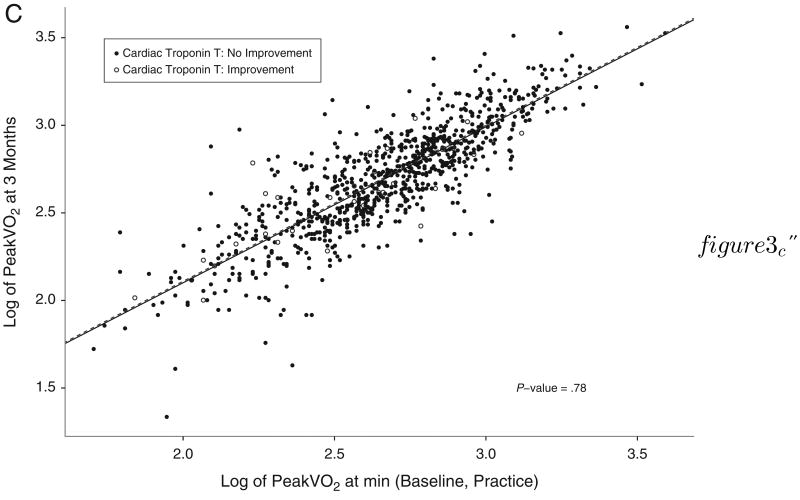
Figure 3.
Change in baseline and 3-month peak VO2 according to biomarker improvement. Scatter plots depicting the baseline (x-axis) and 3 month (y-axis) measurements of log-transformed peak VO2 according to levels of NT-proBNP (A), hs-CRP (B), and cTnT (C), grouped according to biomarker improvement versus no improvement at 3-month follow-up.


