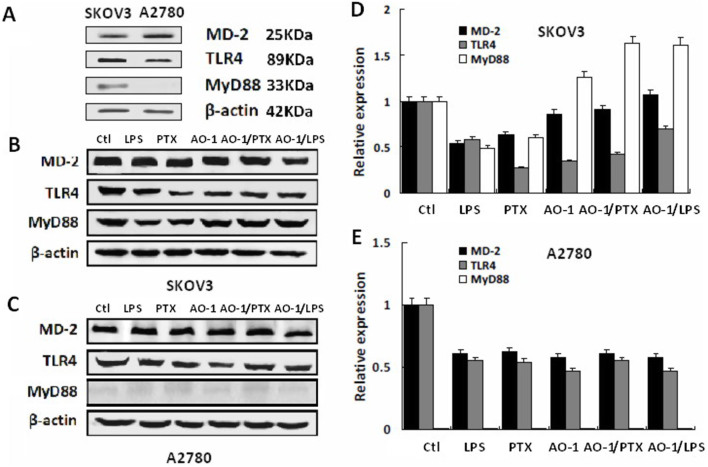
Figure 1. Expression of TLR4, MD-2 and MyD88 proteins by EOC cells treated with LPS, PTX and AO-1.
(A). Expression of TLR4, MD-2 and MyD88 proteins by SKOV3 and A2780 cells (n = 3); (B–E). Protein expression of TLR4, MD-2 and MyD88 induced by LPS (1 μg/ml), paclitaxel (0.01 μmol/L) and AO-1(100 μmol/L), and by combination of LPS (1 μg/ml), paclitaxel (0.01 μmol/L) with AO-1 (100 μmol/L) in SKOV3 cells and A2780 cell, respectively (n = 3). Ctl and PTX represent the control and pacliaxel, respectively.

