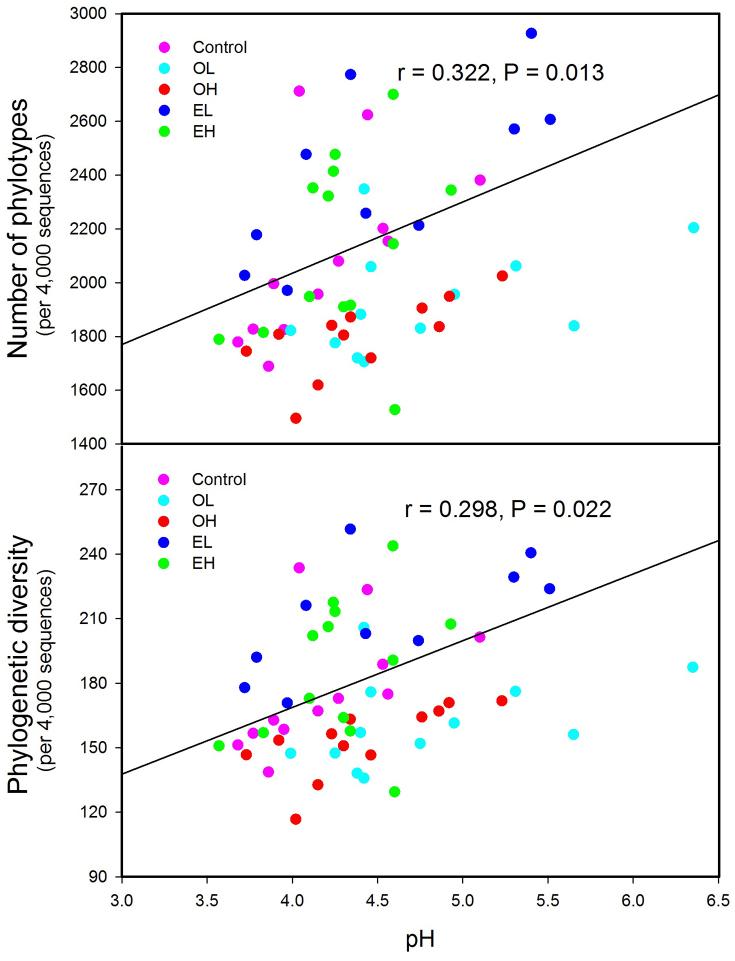
Figure 5. The relationship between soil pH and bacterial OTUs phylotype richness and phylogenetic diversity by linear regression analyses.
The communities were randomly sampled at the 4,000 sequences level. Individual points represent different samples across all the treatments. OL: one year after low intensity fire; OH: one year after high intensity fire; EL: 11 years after low intensity fire; EH: 11 years after high intensity fire. P < 0.05, significant convention.

