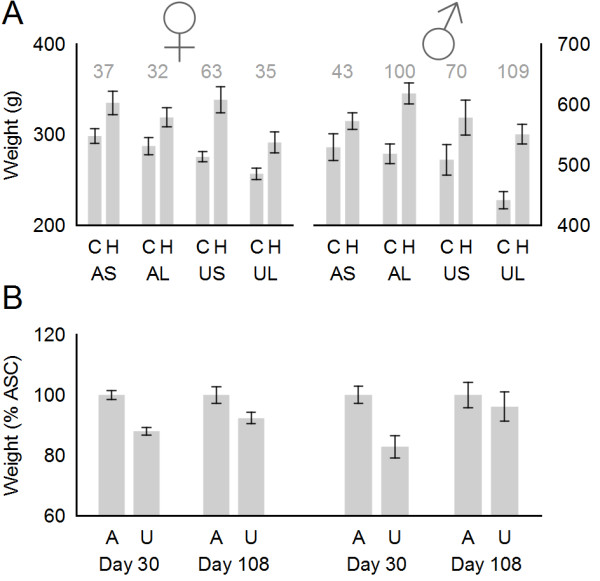
Figure 3.

Comparison of selected male and female growth data. A: Bar chart showing average weight in g +/− s.e.m. for all cohorts at day 108. Numbers in grey indicate the absolute weight gain on HF diet relative to chow diet for the AD/Sal, AD/Lep, UN/Sal and UN/Lep groups. B: Bar chart showing weight of UN/Sal/Chow (U) relative to AD/Sal/Chow (A) at day 30 and day 108. Left = females, right = males.
