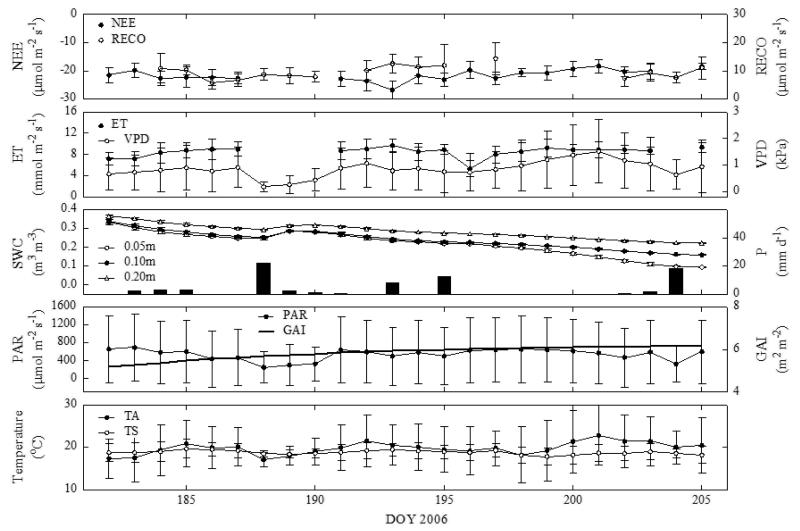
Figure 4.
Same as Fig. 3, but for the 2006 drying period. Soil water contents at 0.1 and 0.2 m depth are shown in addition to 0.05 m. Note that soil drying continued until DOY 208, when a series of rain storms increased soil water content up to field capacity, but the grass was cut already on DOY 206 turning the site temporarily into a source of CO2 (Wohlfahrt et al., 2008).

