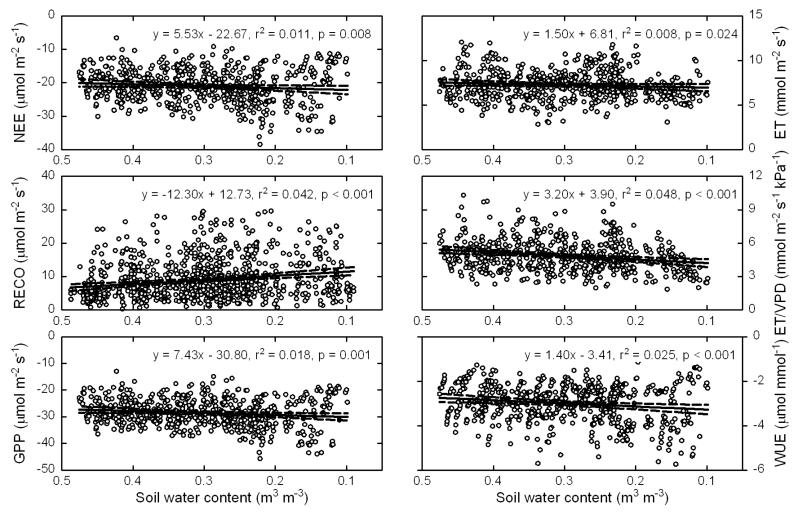
Figure 5.
Daytime half-hourly measurements (symbols) from the period 2001-2009 of net ecosystem CO2 exchange (NEE), nighttime ecosystem respiration (RECO), gross primary production (GPP), evapotranspiration (ET), ET normalised by the vapour pressure deficit (VPD), and water use efficiency (WUE; NEE/ET) as a function of volumetric soil water content (SWC; 0.05 m depth). Solid and dashed lines represent linear regressions and associated 95% confidence intervals. Note that the values on the x-axis are in descending order.

