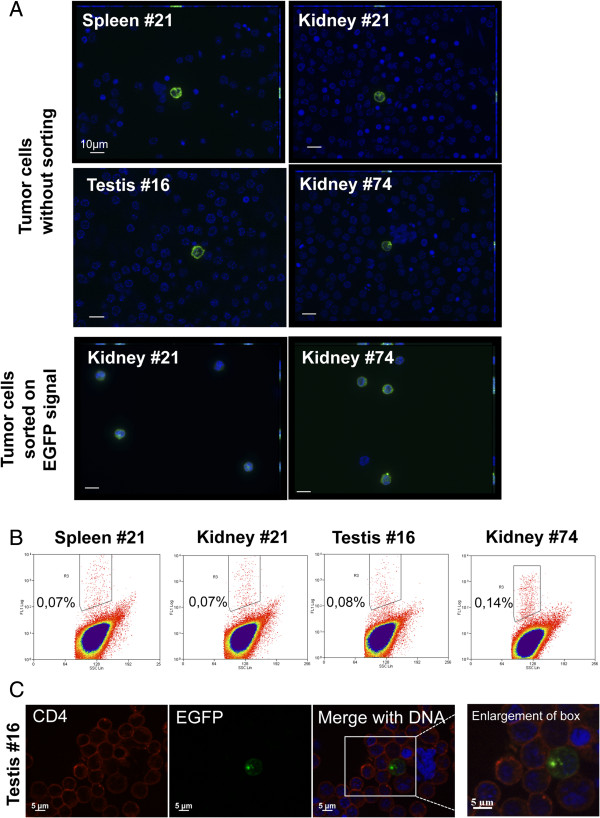
Figure 4.
EGFP fluorescent cells in rRB-1B EGFP22-induced tumors and selection by cell-sorting. A. Microscopy analysis of tumor cells with or without cell-sorting on the basis of EGFP fluorescence. Tumor cells, purified on MSL, were attached to glass coverslips by cytospin, stained by Hoechst 33342 dye (blue) and analyzed by fluorescence microscopy for EGFP signal and labelled nuclei. Cells from four different tumors are presented without cell-sorting. Cells from kidney #21 and #74 are presented with cell-sorting demonstrating the enrichment in EGFP-positive cells. Bars represent 10 μm. B. Flow cytometry analysis of tumor cells from four different rRB-RB EGFP22-induced tumors, after MSL purification. The percentage of EGFP-positive cells in each cell preparation is indicated on each FL1/SSC graph. C. Cells from a tumor (testis #16), without cell sorting, examined after CD4 antibody staining for CD4 and EGFP signal.

