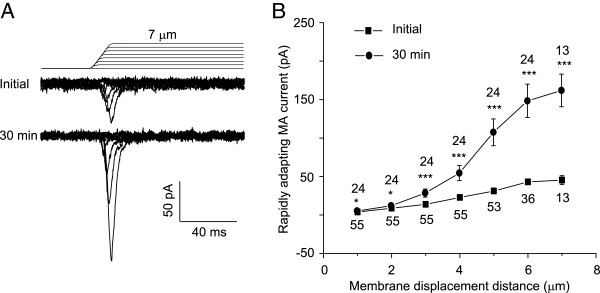
Figure 2.

Run-up of RA currents in DRG neurons at different membrane displacement distances. A) Two sets of sample traces of RA currents elicited by different membrane displacement steps. Top panel, sample recording at the initial time after establishing the whole-cell mode. Bottom panel, recording 30 min after establishing the whole-cell mode. Membrane displacement steps are indicated above RA current traces. B) Summary data of the RA currents at different membrane displacement distances. Solid squares, the initial RA currents immediately after establishing the whole-cell mode (n = 13–55); Solid circles, the RA currents measured 30 min after establishing the whole-cell mode (n = 13–24). The number near each symbol indicates the number of cells tested at each displacement distance. *P < 0.05, ***P < 0.001, comparing the RA currents between initial time and 30 min after the whole-cell mode.
