Figure 4.
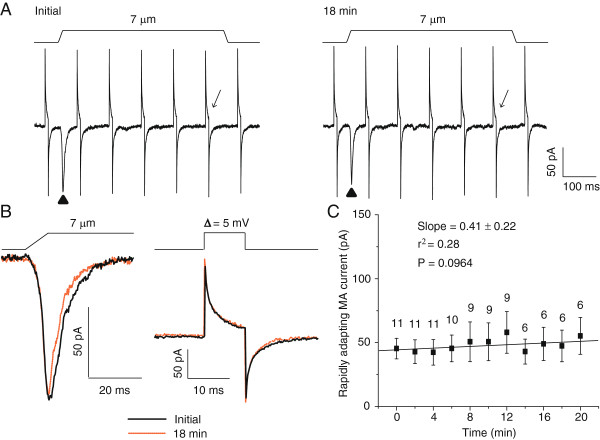
Lack of RA current run-up in DRG neurons using the perforated patch-clamp recording configuration. A) Sample traces of RA currents in a DRG neuron measured initially (Left panel) and 18 min later (Right panel). The initial measurement was performed after the patched membrane was perforated to yield a stable access resistance. B) The RA currents (left panel) and membrane tests (right panel) in A at expanded scales. The RA currents and membrane tests at initial time are in solid lines and 30 min later in dashed lines. C) Summary data of the time course of RA currents measured using the perforated patch-clamp recording technique (n = 6–11). The slope and the coefficient of determination (r2) of the linear regression are given in the graph. The P value indicates how significant is the slop (i.e. the trend of change) different from zero (i.e. no change). The number on the top of each symbol indicates the number of cells at each time point.

