Figure 4.

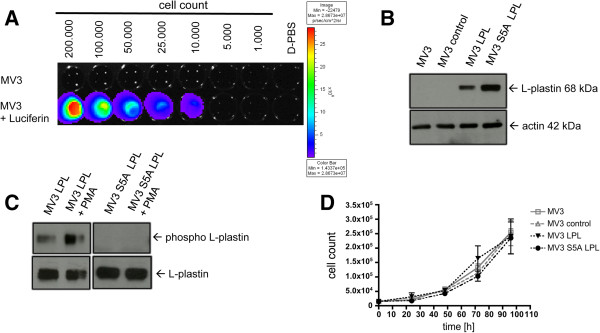
Phosphorylation of L-plastin in melanoma cells occurs spontaneously at Ser5. (A) Bioluminescence imaging of MV3 pCAGG3.1luc2 clone 2 (MV3) cells in vitro. The color bar on the right indicates the signal intensity range (p/s/cm2/sr). (B) Western blot analysis of L-plastin levels in different MV3 cells: untransfected MV3 cells (MV3), MV3 cells transfected with a control vector (MV3 control), or MV3 cells expressing either LPL (MV3 LPL) or S5A LPL (MV3 S5A LPL). (C) L-plastin phosphorylation, detected via a phospho Ser5 L-plastin antibody in Western Blot, occurs in MV3 cells expressing WT LPL plus and minus PMA stimulation but not in MV3 cells expressing S5A LPL. (D) Proliferation of the different MV3 cells in vitro. Data represent means ± SEM, experiments were repeated at least three times with samples in triplicates.
