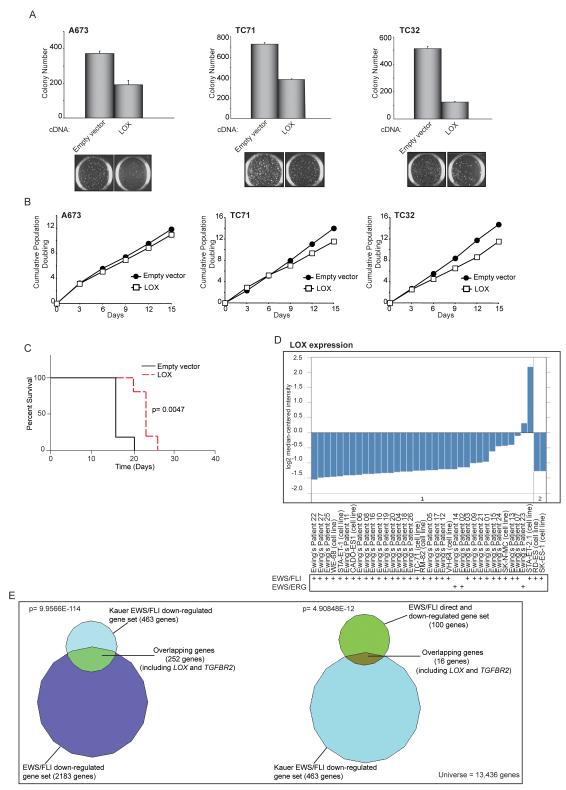
Figure 2. LOX functions as a tumor suppressor in Ewing sarcoma.
(A) Quantification of colonies formed in soft agar by A673, TC71 and TC32 cells expressing a 3X-FLAG LOX cDNA construct in comparison to an empty vector control. Error bars indicate standard deviations of duplicate assays. Representative images of soft agar colonies are included.
(B) Growth assays (3T5) for A673, TC71 and TC32 cells described in (A).
(C) Survival curves for immunodeficient mice injected with TC32 cells expressing 3X-FLAG LOX or an empty vector construct. Five mice underwent bilateral subcutaneous injection for each condition, and each animal was sacrificed once one of their tumors reached a 2 cm endpoint. Percent survival was plotted as a Kaplan-Meier survival curve using GraphPad Prism. The log-rank (Mantel-Cox Test) p-value is indicated.
(D) Graphical representation of LOX expression levels in 27 primary Ewing sarcoma patient-derived tumors and 10 Ewing sarcoma cell lines in the Schaefer et al. dataset. The EWS/FLI or EWS/ERG translocation fusion status of each sample is indicated. The reason for the higher levels of LOX expression observed in the STA-ET-2.1 cell line is uncertain, but possibilities include that this cell line may harbor a mutant LOX allele, or perhaps has activated an adaptive “bypass” pathway that allows for growth in the presence of high levels of LOX expression (such as the effect seen in our own xenograft experiments with Ewing sarcoma cells expressing the LOX cDNA (Figures 2C and S2F).
(E) Venn diagram overlaps of EWS/FLI downregulated or EWS/FLI direct downregulated-genes datasets with the Kauer et al. EWS/FLI downregulated-genes dataset. In the Kauer et al. dataset, a molecular function map of Ewing sarcoma was constructed based on an integrative analysis of gene expression profiling experiments following EWS/FLI knock-down in a panel of five Ewing sarcoma cell lines, and 59 primary Ewing sarcoma tumors using mesenchymal progenitor cells (MPC, a suggested cell-of-origin of Ewing sarcoma) as the reference tissue. The Chi-square determined p-values are indicated.

