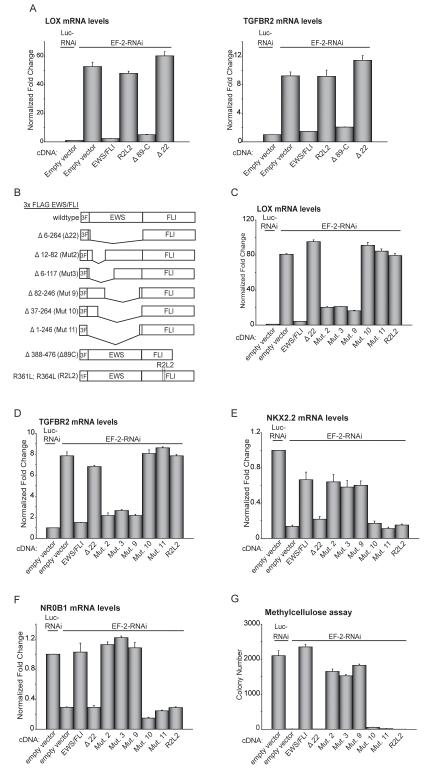
Figure 3. Structure-function analysis of EWS/FLI mediated repression.
(A) qRT-PCR analysis of LOX and TGFBR2 expression in A673 cells following knockdown of EWS/FLI (with the EF-2-RNAi construct) and rescue with 3X-FLAG wild-type EWS/FLI, 3X-FLAG Δ22, 1X-FLAG R2L2, 3X-FLAG Δ89C, or an empty vector control. Luc-RNAi is a negative control vector. Normalized fold enrichment was calculated by determining the fold-change of each condition relative to the control Luc-RNAi condition RNAi, with the data in each condition normalized to an internal housekeeping control gene GAPDH.
(B) Schematic representation of 3X-FLAG (3F) EWS/FLI wild-type and mutant constructs and 1X-FLAG (1F) R2L2 mutant construct. Amino acids deleted/mutated in the EWS and FLI1 domains are indicated.
(C, D) Repression of LOX and TGFBR2, by wild-type EWS/FLI, or mutants, as analyzed by qRT-PCR. EWS/FLI was knocked-down in A673 cells and rescued with the indicated constructs. Error bars indicate standard deviations.
(E, F) Activation of NKX2.2 and NR0B1, by wild-type EWS/FLI, or mutants, as analyzed by qRT-PCR. EWS/FLI was knocked-down in A673 cells and rescued with the indicated constructs. Error bars indicate standard deviations.
(G) Quantification of colonies formed in methylcellulose by A673 cells infected with the indicated RNAi and cDNA constructs. Error bars indicate standard deviations of duplicate assays.

