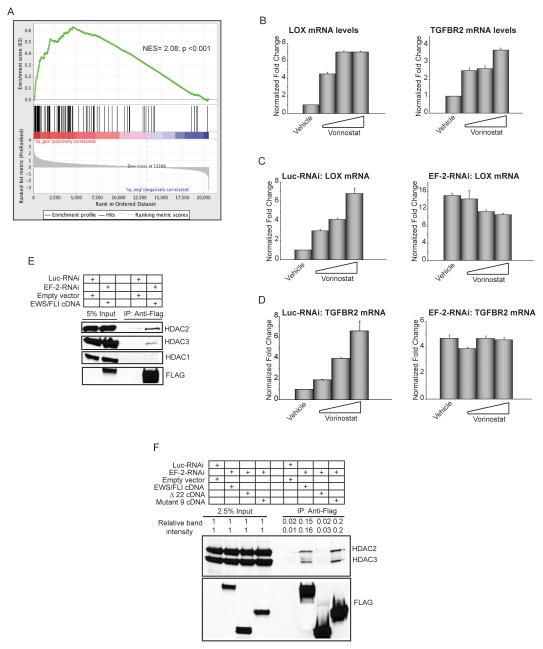
Figure 5. Transcriptional repression by EWS/FLI is mediated by HDACs.
(A) Gene set enrichment analysis (GSEA) using vorinostat-regulated genes in A673 Ewing sarcoma cells as the rank-ordered dataset and the 100 EWS/FLI direct downregulated targets as the geneset. The positions of the 100 genes are indicated as black vertical lines in the center portion of the panel. The normalized enrichment score (NES) and p-value are shown.
(B) qRT-PCR analysis of LOX and TGFBR2 in A673 cells treated with increasing concentrations of the HDAC-inhibitor vorinostat. Normalized fold enrichment was calculated by determining the fold-change of each condition relative to the control vehicle treated condition, with the data in each condition normalized to an internal housekeeping control gene GAPDH. Error bars indicate standard deviations.
(C, D) qRT-PCR analysis of LOX and TGFBR2 in A673 cells expressing a control RNAi or EWS/FLI RNAi construct (EF-2-RNAi) treated with increasing concentrations of the HDAC inhibitor vorinostat. Error bars indicate standard deviations.
(E, F) Co-immunoprecipitation of EWS/FLI and HDACs. Endogenous EWS/FLI was knocked-down in A673 cells (with the EF-2-RNAi) and replaced with 3X-FLAG-tagged versions of the indicated cDNAs that were resistant to the RNAi construct. Luc-RNAi is a negative control. Relative band intensities were quantified using ImageQuant.

