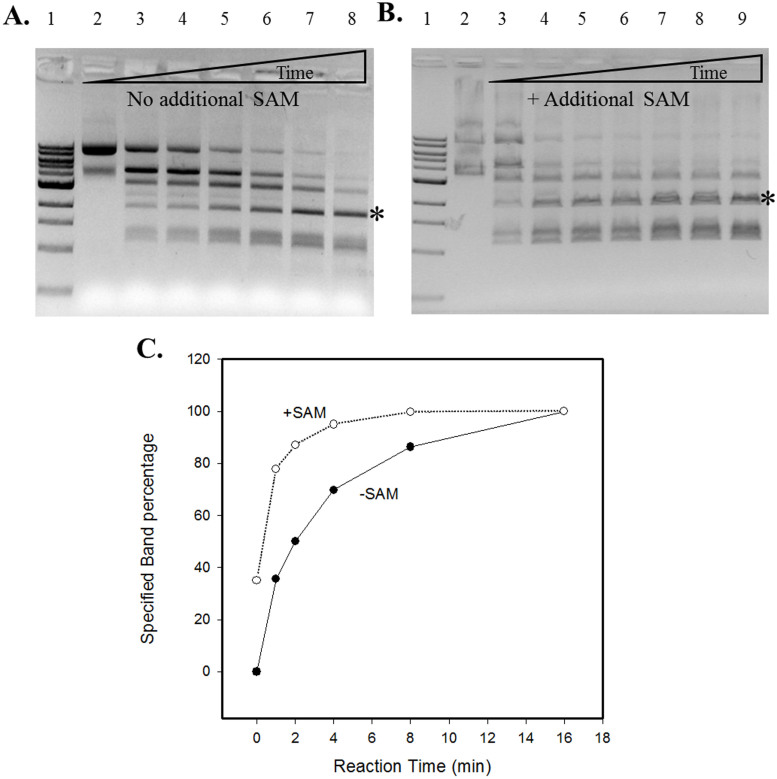
Figure 2. Time course study of Tth111II digestion in the absence or presence of additional SAM.
The reaction conditions were same as described in Figure 1 legend, but with 4 units per lane for various times. Panel (A): no additional SAM added. Lane 1, 1 kb DNA ladder; Lane 2–8: 0, 1, 2, 4, 8, 16, 32 min digestion. Panel (B), 320 μM SAM added; lane 2, uncut pBR322; lanes 3–9: 0, 1, 2, 4, 8, 16, 32 min digestion. (C): A graphic representation of one cleavage product band indicated by “*” as the result of Tth111II digestion with or without additional SAM.

